
M20
NGC 6514, Triffid Nebula
47’ x 31’ | 0.3”/px | 9433 × 6289 px | full resolution
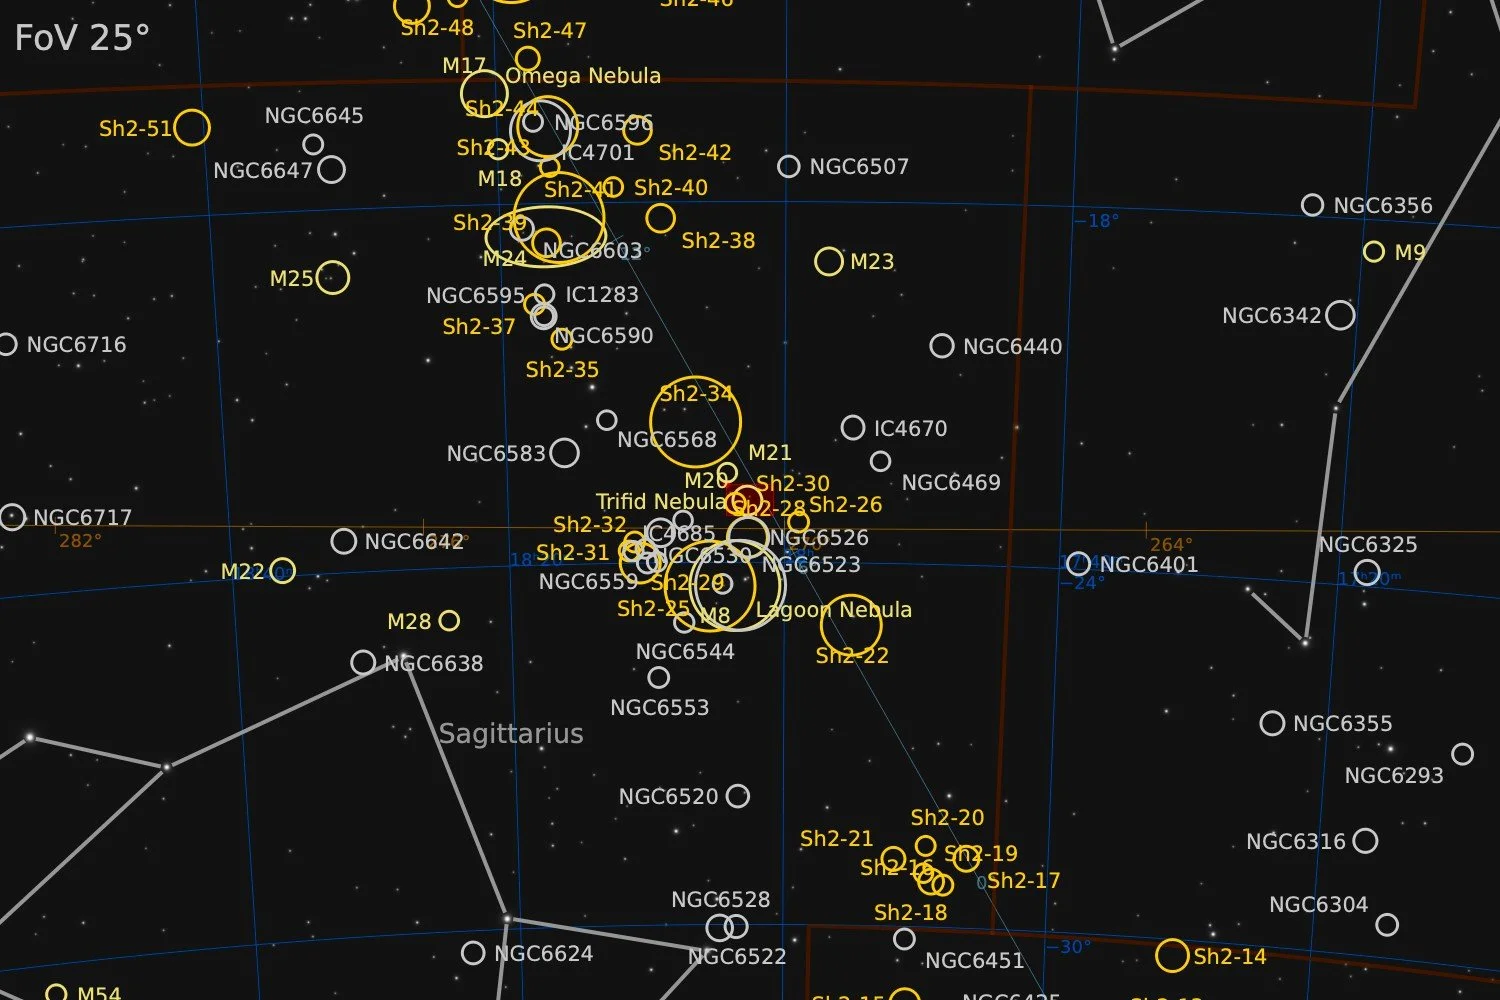
Sagittarius
RA 18h 02m Dec -22° 57’ | 0°

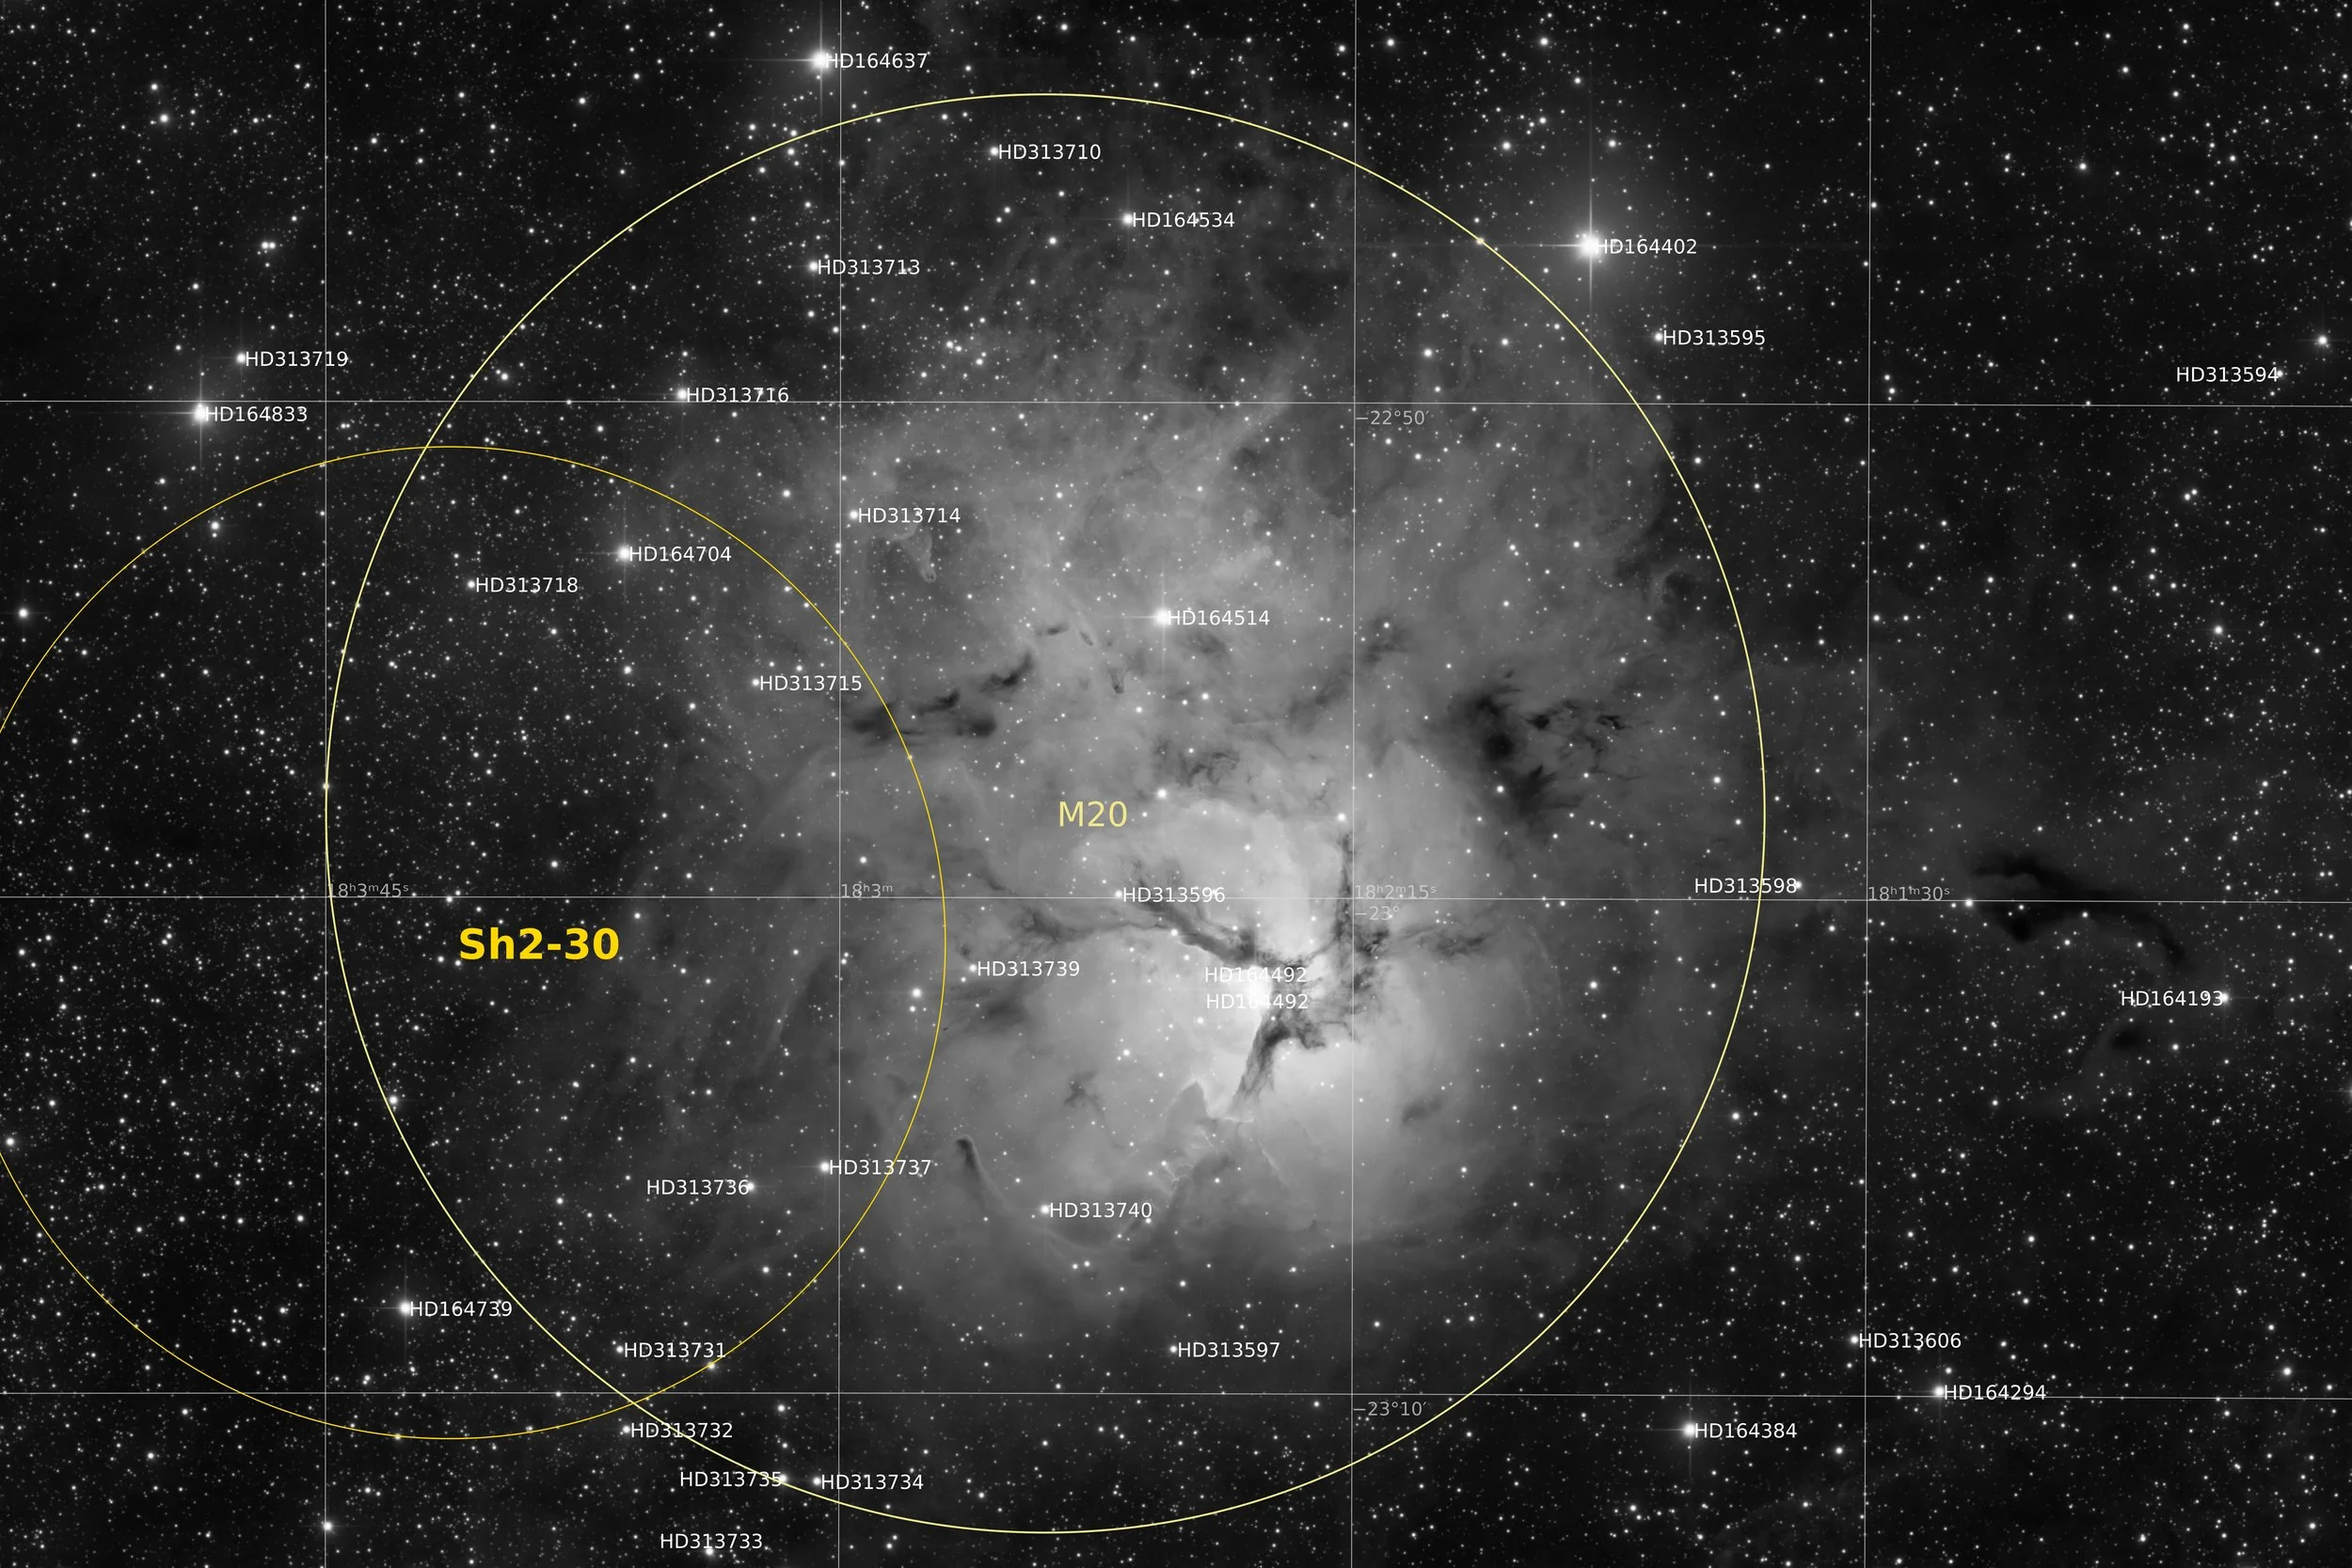
Messier 20, also called the Trifid Nebula, is an H II region in the north-west of Sagittarius in a star-forming region in the Milky Way's Scutum–Centaurus Arm. It was discovered by Charles Messier on June 5, 1764. Its name means 'three-lobe'. The object is an unusual combination of an open cluster of stars, an emission nebula (the relatively dense, reddish-pink portion), a reflection nebula (the mainly NorthNorthEast blue portion), and a dark nebula (the apparent 'gaps' in the former that cause the trifurcated appearance, also designated Barnard 85). The most massive star that has formed in this region is HD 164492A, an O7.5III star with a mass more than 20 times the mass of the Sun. This star is surrounded by a cluster of approximately 3100 young stars.
source: Wikipedia
Data Acquisition
Data was collected over 9 nights during mid June 2025, using a 14” reflector telescope with full-frame camera at the remote observatory in Spain. Data was gathered using standard LRGB filters. A total of approximately 19 hours of data was finally combined to create the final image.
Location Remote hosting facility IC Astronomy in Oria, Spain (37°N 2°W)
Sessions
Frames
Equipment
Telescope
Mount
Camera
Filters
Guiding
Accessoires
Software
Planewave CDK14 (2563mm @ f/7.2), Optec Gemini Rotating focuser
10Micron GM2000HPS, custom pier
Moravian C3-61000 Pro (full frame), cooled to -10 ºC
Chroma 2” LRGB unmounted, Moravian filterwheel L, 7-position
Unguided
Compulab Tensor I-22, Dragonfly, Pegasus Ultimate Powerbox v2
Voyager Advanced, Viking, Mountwizzard4, Astroplanner, PixInsight 1.9.3
Processing
All processing was done in Pixsinsight unless stated otherwise. Default features were enhanced using scripts and tools from RC-Astro, SetiAstro, GraXpert, CosmicPhotons and others. Images were calibrated using 50 Darks, 50 Flats, and 50 Flat-Darks, registered and integrated using WeightedBatchPreProcessing (WBPP). The processing workflow diagram below outlines the steps taken to create the final image.
The image has a lot of signal throughout the frame, making background correction more challenging. GraXPert was not very successful in identifying the background, and instead flattened the center of the image quite a bit. The MultiscaleGradientCorrection could not be applied because this part of the sky is not covered yet in the MARS database. So in the end I went back to the good old DynamicBackground expression and manually selected points across the edges of the image that resembled little pieces of background. This worked well.
Typically for an image like this, I would use LocalHistogramEqualization to enhance local contrast and definition. But inspired by this video, a different technique was used for this image. The technique is based on the frequency separation filter and the workflow works as follows.
Sharpening using Frequency Separation
The process described here is based on using Affinity Photo 2 as a non-destructive photo-editor. Similar results can be achieved using Photoshop, but the tools may be working slightly differently.
Export and otherwise fully processed Luminance master as a 16-bit TIFF file, without any compression.
Load the image in Affinity Photo and duplicate the base layer
Apply the filter Filters > Frequency Separation, adjust radius to 100px and press ‘apply’
The Frequency Separation tool can be found in most non-destructive photo-editors
The image now separates into a high-frequency and a low-frequency image. The first one includes all the structural information and the second one includes brightness and colour tonalities. The low-frequency image can be turned off, as we’re only interested in the High-frequency image.
Choose a blend-mode for the high-frequency image. I chose ‘vivid light’, but feel free to experiment with other blend-modes.
Often the effect will be too strong, and has to be tuned down using the opacity slider. In this case opacity was set to 50%
Export the now much sharper and more defined image as 16-bit grayscale TIFF image and import back into PixInsight
By separating the high frequency signal, containing the detail of the image and folding that back over the original image using a particular blend-mode (here: ‘vivid light’), structure, contrast and depth in an image can be increase in a very natural way. The method described here is based on the method in Affinity Photo 2, but other non-destructive photo editors, such as Photoshop have similar tools.
When the image was finalised, the brightness in the center of the nebula was rather high, somewhat obscuring some of the bright stars in the center. While I tried several attempts to selectively lower the brightness in the center and/or reduce star brightness in the center, none of them really gave a pleasing result. In line with earlier experiences, any type of brightness recovery using any kind of masking is very tricky and quickly shows the structure of the mask, making the adjustment unnatural. An alternative might have been to have a full HDR workflow from the beginning, but I decided not to go that route. The bright center of the nebula, albeit obscuring the bright stars a bit, makes for a nice glow in the image, which makes it stand out quite nicely.
The full processing followed the workflow as is shown below.
Processing workflow (click to enlarge)
This image has been published on Astrobin.